VISUALIZING THE COVID-19 PANDEMIC
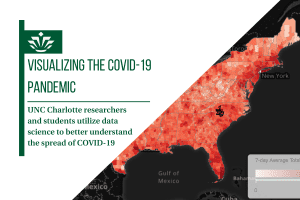
As the United States battles a drastic resurgence in coronavirus cases, a group of UNC Charlotte researchers aggregated, analyzed and visualized publicly available COVID-19 data to produce an interactive dashboard in order to better understand the rapid spread of the virus. Click below to read more.